Myocardial image quality estimation
![]()
![]()
This notebook demonstrates regional image quality scoring for apical echocardiography views using a MobileNetV2-based model.
References:
Paper: Regional Image Quality Scoring for 2-D Echocardiography Using Deep Learning, Gilles Van De Vyver et al.
GitHub: arqee (original implementation of the model and visualization)
‼️ Important: This notebook is optimized for GPU/TPU. Code execution on a CPU may be very slow.
If you are running in Colab, please enable a hardware accelerator via:
Runtime → Change runtime type → Hardware accelerator → GPU/TPU 🚀.
[1]:
%%capture
%pip install zea
%pip install onnxruntime # needed for both segmentation and image quality models
[2]:
import os

os.environ["KERAS_BACKEND"] = "tensorflow"
os.environ["TF_CPP_MIN_LOG_LEVEL"] = "3"

import matplotlib.pyplot as plt
from keras import ops
from zea.visualize import plot_shape_from_mask
import numpy as np

from zea import init_device
from zea.backend.tensorflow.dataloader import make_dataloader
from zea.visualize import set_mpl_style
from zea.io_lib import matplotlib_figure_to_numpy, save_video

init_device(verbose=False)
set_mpl_style()
zea: Using backend 'tensorflow'
Loading models
To predict regional image quality, we need both:
a segmentation model (for LV and myocardium regions)
the image quality model
For more details on segmentation, see the LV segmentation notebook.
[3]:
from zea.models.regional_quality import MobileNetv2RegionalQuality

quality_model = MobileNetv2RegionalQuality.from_preset("mobilenetv2_regional_quality")
[4]:
from zea.models.lv_segmentation import AugmentedCamusSeg

seg_model = AugmentedCamusSeg.from_preset("augmented_camus_seg")
Load CAMUS Validation Data
We load a batch of images from the CAMUS validation set.
[5]:
# Load a batch and run both models.
n_imgs = 1
INFERENCE_SIZE = 256
val_dataset = make_dataloader(
    "hf://zeahub/camus-sample/val",
    key="data/image_sc",
    batch_size=n_imgs,
    shuffle=True,
    image_range=[-45, 0],
    clip_image_range=True,
    normalization_range=[-1, 1],
    image_size=(INFERENCE_SIZE, INFERENCE_SIZE),
    resize_type="resize",
    seed=42,
    n_frames=10,
)
batch = next(iter(val_dataset))
# bring frame dimension to front
# [frames, height, width, channels]
batch = ops.swapaxes(batch, 0, -1)
zea: Using pregenerated dataset info file: /root/.cache/zea/huggingface/datasets/datasets--zeahub--camus-sample/snapshots/617cf91a1267b5ffbcfafe9bebf0813c7cee8493/val/dataset_info.yaml ...
zea: ...for reading file paths in /root/.cache/zea/huggingface/datasets/datasets--zeahub--camus-sample/snapshots/617cf91a1267b5ffbcfafe9bebf0813c7cee8493/val
zea: Dataset was validated on October 01, 2025
zea: Remove /root/.cache/zea/huggingface/datasets/datasets--zeahub--camus-sample/snapshots/617cf91a1267b5ffbcfafe9bebf0813c7cee8493/val/validated.flag if you want to redo validation.
zea: WARNING H5Generator: Not all files have the same shape. This can lead to issues when resizing images later....
zea: H5Generator: Shuffled data.
zea: H5Generator: Shuffled data.
Now we will run the segmentation model to get the LV and myocardium masks, and then feed those to the image quality model to get regional quality scores.
[6]:
# onnx model needs [batch, channels, height, width]
batch_np = ops.convert_to_numpy(batch)
onnx_input = np.transpose(batch_np, (0, 3, 1, 2))
# Run the image quality model
scores = quality_model.call(onnx_input)
scores = np.array(scores)
# Run the segmentation model (LV + myocardium)
outputs_seg = seg_model.call(onnx_input)
outputs_seg = np.array(outputs_seg)
masks = np.argmax(outputs_seg, axis=1).astype(np.uint8)
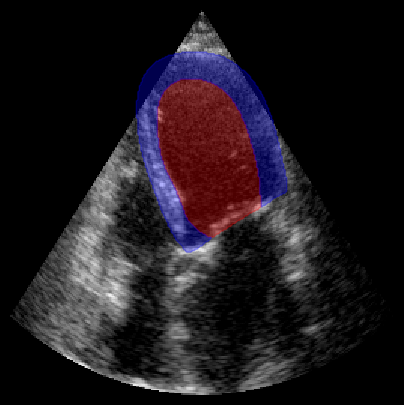
fig, ax = plt.subplots(1, 1, figsize=(5, 5))
ax.imshow(batch_np[0], cmap="gray")
plot_shape_from_mask(ax, masks[0] == 1, color="red", alpha=0.3) # LV
plot_shape_from_mask(ax, masks[0] == 2, color="blue", alpha=0.3) # Myocardium
plt.axis("off")
plt.show()
region_labels = [
"basal_left",
"mid_left",
"apical_left",
"apical_right",
"mid_right",
"basal_right",
"annulus_left",
"annulus_right",
]
print("Predicted regional image quality scores:")
for label, score in zip(region_labels, scores[0]):
print(f" {label}: {score:.2f}")
Predicted regional image quality scores:
  basal_left: 4.59
  mid_left: 5.21
  apical_left: 3.60
  apical_right: 2.37
  mid_right: 2.64
  basal_right: 2.99
  annulus_left: 6.01
  annulus_right: 4.85
We need the arqee package for a complete visualization. The colored overlay shows the predicted regional image quality for each myocardial region.
[7]:
%%capture
%pip install git+https://github.com/GillesVanDeVyver/arqee
[8]:
import arqee

frames = []
for image, mask, labels in zip(batch_np, masks, scores):
    labels = [int(i) for i in labels]
    image = np.squeeze(image, axis=-1)
    fig, *_ = arqee.plot_quality_prediction_result(image, mask, labels)
    frames.append(matplotlib_figure_to_numpy(fig))
    plt.close(fig)

save_video(frames, "./myocardial_image_quality.gif", fps=10)
zea: Succesfully saved GIF to -> ./myocardial_image_quality.gif